Runtime Analysis
A PE file tells you about its sections and directories, but modern malware is often written in Go, Rust, .NET, NativeAOT or Python (PyInstaller), and what matters about those binaries lives in runtime metadata the PE format knows nothing about: Go's build info and function table, Rust's panic-location records, .NET's metadata tables. PPEE's Analysis views read that metadata and turn it into a short, linked report.
Derived views, not PE structures
Analysis is built from the file's structures, not read out of them, so PPEE keeps it apart from everything else. In the GUI, Analysis nodes have a diamond glyph and a teal label, with a banner naming the sources. In JSON it lives under its own analysis key. Nothing here is data stored in the PE headers, and nothing in the file is ever changed.
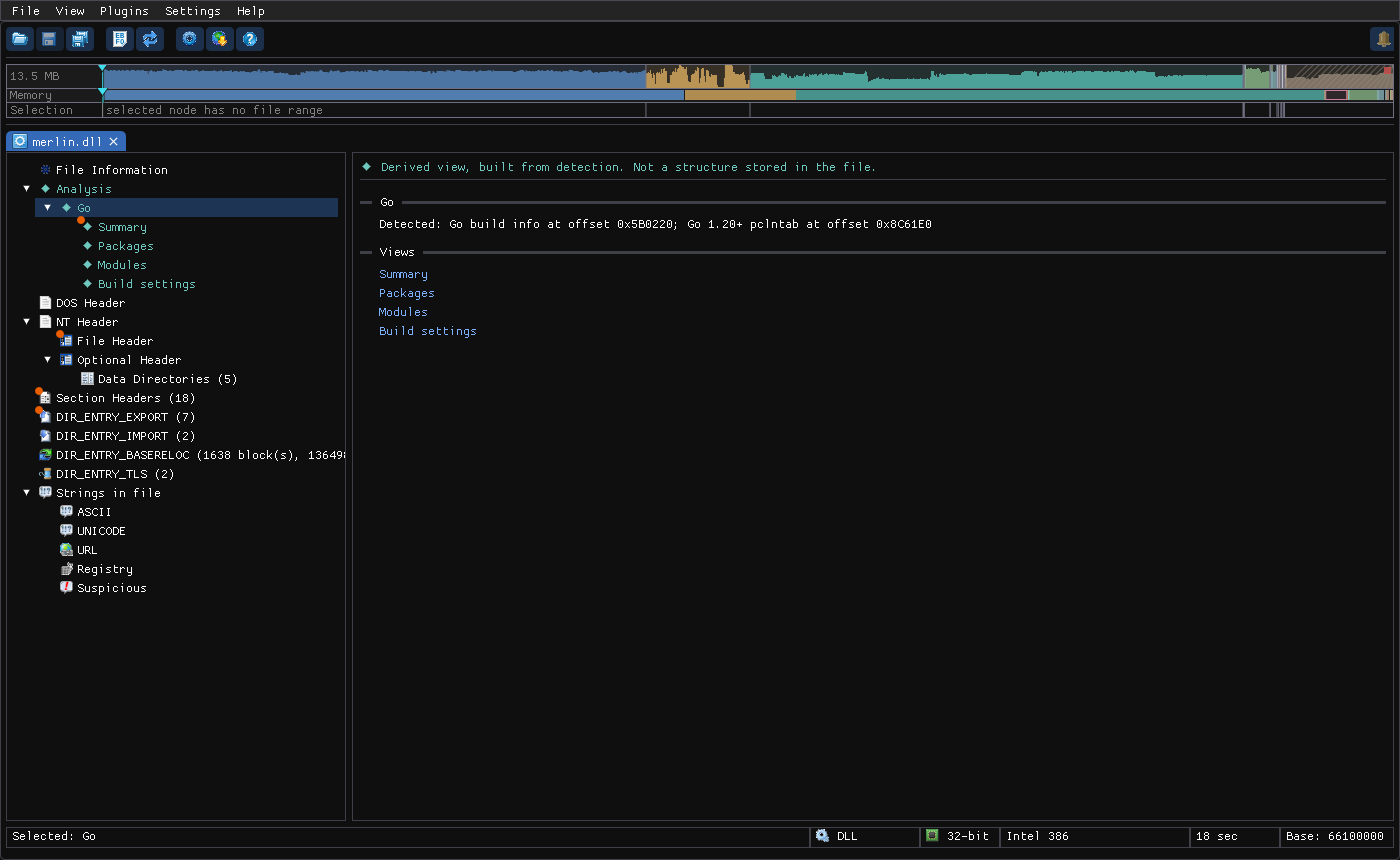
Linux screenshot: The Analysis node for a Go DLL: detected runtime and its views
What is detected
An analyzer runs only when it finds its runtime's signature. The Code analyzer is the exception: it reads the machine code of every x86/x64 file, so a native C++ binary gets a Code section and nothing else.
Above the runtimes, every file gets Facts: what its structure shows, stated as facts, the same engine as MCP's triage_pe (see The Analysis node).
| Runtime | Detected from | Views | Page |
|---|---|---|---|
| .NET | COM descriptor (data directory 14) + metadata | Summary · Imports · Native imports · Exports · Resources | .NET |
| Go | Go build info and the pclntab function table | Summary · Packages · Modules · Build settings | Go |
| Rust | rustc standard-library paths and panic-location records | Summary · Project files | Rust |
| NativeAOT | a .managed section and the NativeAOT runtime's markers | Summary (plus assemblies and methods when the module header is present) | NativeAOT |
| PyInstaller | the archive cookie at the end of the file | Summary · Entries | PyInstaller |
| Code | any x86/x64 machine code | Summary · API call sites · Patterns · Functions | Code |
If more than one runtime is detected, each gets its own section. Views with no rows (for instance Native imports on an assembly without P/Invoke) are left out.
How to read a Summary
Every Summary is a short report divided into headings. Values are links: they select the raw tree node, jump to the metadata row, or open the hex view on the exact bytes the value came from. Warnings appear as amber notes.
| Heading | Typical content |
|---|---|
| Identity / Compiler | Language and compiler version, assembly or module name, reproducible-build flag, strong name |
| Build | Target OS/architecture, build flags, linker flags |
| Code / Runtime and execution | Function table, entry points, framework, flags |
| Dependencies | Modules, crates, referenced assemblies, P/Invoke |
| Contents | Resources, metadata streams |
| Layout clues | Overlay size, sections with no file data, writable + executable sections, entropy |
| Structure | Anomalies: duplicate or non-standard metadata streams and similar |
Reproducible builds
When the debug directory has a REPRO entry, every Summary says so: the timestamps in the file are a content hash, not a build time. Don't date the sample from them. If the entry carries the hash itself, it's shown and linked to its bytes.
The deep pass
Some checks are expensive, so they run on request:
| Runtime | The deep pass adds |
|---|---|
| .NET | Reads every method body and reports the ones that don't decode as IL (encrypted or junk code), and measures the entropy of appended data and the metadata's section (managed resources get theirs without it) |
| Go, Rust, NativeAOT | Measures the entropy of appended data (overlay) |
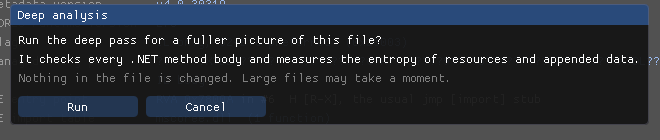
The Summary says what hasn't been read yet, with a Run the deep pass... link. It confirms first ("Nothing in the file is changed"), then runs in the background with a progress bar, and rebuilds the Analysis node in place.
Linux screenshot: Deep analysis confirmation
From the command line, use --analysis-deep.
Where to get it
Select Analysis in the tree (right after File Information). Table rows offer Go to … (also on double-click) to jump to the structure behind them.
ppee-cli --analysis f.exe          # text report
ppee-cli --analysis-deep f.exe     # plus the deep pass
ppee-cli --json --analysis f.exe | jq .analysis
--all and running with no section switch include it too. See --analysis.
{ "analysis": { "runtimes": [ {
    "key": "go", "name": "Go", "evidence": "Go build info at offset 0x5B0220; …",
    "views": [ { "key": "analysis.go.summary", "title": "Summary", "source": "…", "tone": "warning",
                 "blocks": [ … ], "links": [ … ] },
               { "key": "analysis.go.packages", "title": "Packages", "table": { "columns": […], "rows": […] }, "links": [ … ] } ]
} ] } }
An empty runtimes array means no analyzer recognised the file. Full schema: JSON output.
analyze_pe accepts analysis and analysis-deep in sections, and includes analysis by default. Ask "what was this binary built with, and what does its metadata reveal?"
Limits worth knowing
- Analysis depends on metadata that the author or a protector can remove or forge. Absence proves nothing, and a stripped Go binary gives a thinner report. Where PPEE can tell (for example, most Go function names were rewritten), the Summary says so.
- Versions are guessed from markers where the file doesn't state them, and are labelled (guessed).
- The deep pass reads only what is in the file. Method bodies that a protector decrypts at run time show up as bodies that do not decode as IL, not as code.
Related: .NET · Go · Rust · NativeAOT · Code · COM descriptor directory