Code
The Code analyzer looks at the machine code of any x86 or x64 PE file, not at runtime metadata. It answers three questions an analyst asks first:
- Is the entry point where a compiler would put it? If not, something was added after linking: a packer, a protector or a file infector.
- Which imported APIs does the code really call, and from where? An import only says what a file can do; a call site shows it does.
- Does the code do anything worth a look? PEB reads, xor decoder loops, strings built on the stack, known crypto constants.
Every claim comes with its evidence: the instructions it was found in, linked to the Code window.
Detected on every x86/x64 file
The analyzer runs on any file with x86 or x64 machine code, so it appears next to the .NET, Go, Rust and NativeAOT analyzers when those are detected too. The engine is Zydis; nothing is executed.
Views
| View | Shows |
|---|---|
| Summary | Entry point (section, anomalies, first instructions), TLS callbacks, What the code does, Imports in use per capability, coverage |
| API call sites | Each imported API with its capability group and number of call sites; expand a row for every site (function+offset, address, instruction) |
| Patterns | Every code pattern found: id, containing function, address, description, and its exception-handling context |
| Functions | Function starts, how each was found (entry point, TLS, export, .pdata, CFG table, relocated pointer, direct call), name and caller count |
Windows screenshot: API call sites view: imported APIs with their capability topic and call-site count, and the five GetProcAddress calls below
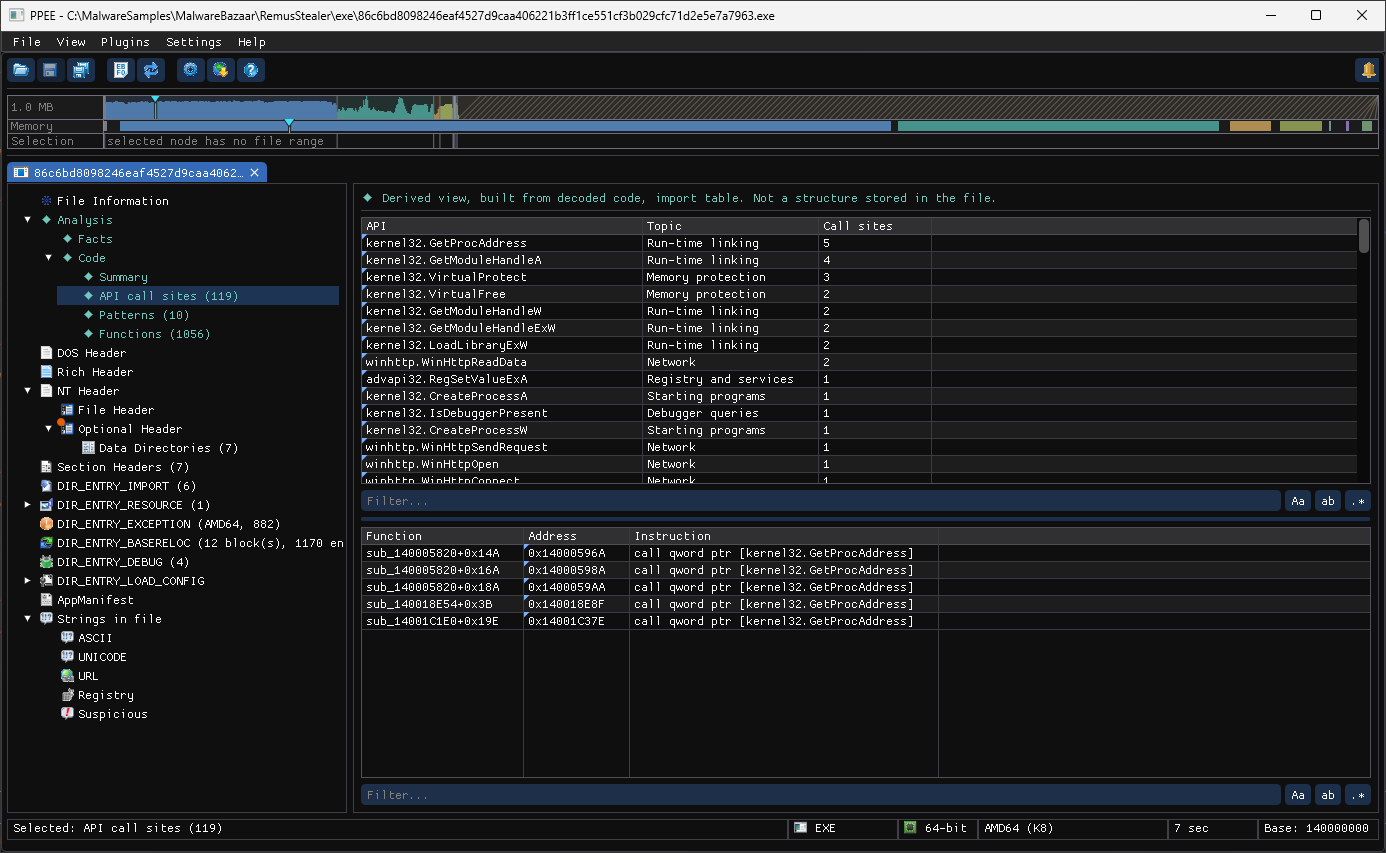
API call sites for the shellcode loader from walkthrough 2: GetProcAddress is called from 5 places, and selecting it lists each call (function+offset, address, instruction) below. Every row has the corner mark that opens the Code window there.
Walkthrough 1: a UPX-packed ransomware dropper
At a glance
- Sample
77549422a5306f905d68153b1f649745d330d45e564c927046132ecc1d20ae3e.exe(7 KB, PE32, from a ransomware set)- Question
- Is it packed, and where does the real program start?
- You'll use
- Code Summary ·
--disasm· Code window
$ ppee-cli --analysis 77549422….exe
Code > Summary  (built from entry point, TLS callbacks, all decoded code)
Entry point
  Address: 0x40A360 [code 0x40A360: entry point]  in UPX1
  [*] Its section is writable and executable.
  [*] It is in UPX1, not in the first code section, UPX0.
  [*] It starts with pushad (saves every general register on the stack).
        0040A360  pushad
        0040A361  mov esi, 0x409015
        0040A366  lea edi, dword ptr [esi-0x8015]
        0040A36C  push edi
        0040A36D  jmp 0x40A37A

Imports in use
  Memory protection: imported, but no call found
  Run-time linking: imported, but no call found

Coverage
  Decoded: 162 instructions, 1 functions
PS C:\> ppee-cli.exe --analysis C:\MalwareSamples\77549422a5306f905d68153b1f649745d330d45e564c927046132ecc1d20ae3e.exe
C:\MalwareSamples\77549422a5306f905d68153b1f649745d330d45e564c927046132ecc1d20ae3e.exe: 7168 bytes, PE32

Analysis (derived views, not PE structures):

Code
  Detected: x86 machine code

Code > Summary  (built from entry point, TLS callbacks, all decoded code)
Entry point
  Address: 0x40A360 [code 0x40A360: entry point]  in UPX1
  [*] Its section is writable and executable.
  [*] It is in UPX1, not in the first code section, UPX0.
  [*] It starts with pushad (saves every general register on the stack).
        0040A360  pushad
        0040A361  mov esi, 0x409015
        0040A366  lea edi, dword ptr [esi-0x8015]
        0040A36C  push edi
        0040A36D  jmp 0x40A37A

What the code does
  - Nothing notable in the decoded code.

Imports in use
  Memory protection: imported, but no call found
  Run-time linking: imported, but no call found

Coverage
  Decoded: 162 instructions, 1 functions
  - Found by following direct calls and jumps from the entry point, TLS callbacks, exports, .pdata, the CFG function table and relocated pointers; code reached only through computed jumps is not covered, so every count is a lower bound.

Code > API call sites (4)  (built from decoded code, import table)
API                      Topic              Call sites
kernel32.VirtualAlloc    Memory protection  0
kernel32.VirtualFree     Memory protection  0
kernel32.VirtualProtect  Memory protection  0
kernel32.GetProcAddress  Run-time linking   0

Code > Patterns (0)  (built from all decoded code)
Pattern  Function  Address  What  Exception handling

Code > Functions (1)  (built from entry point, TLS, exports, .pdata, CFG table, relocated pointers, direct calls)
Address   Found as     Name        Callers
0x40A360  entry point  EntryPoint  0  [code 0x40A360: 0x40A360]
Windows screenshot: Code Summary of the UPX sample: entry point in UPX1 with three warnings, the pushad stub, and 162 decoded instructions
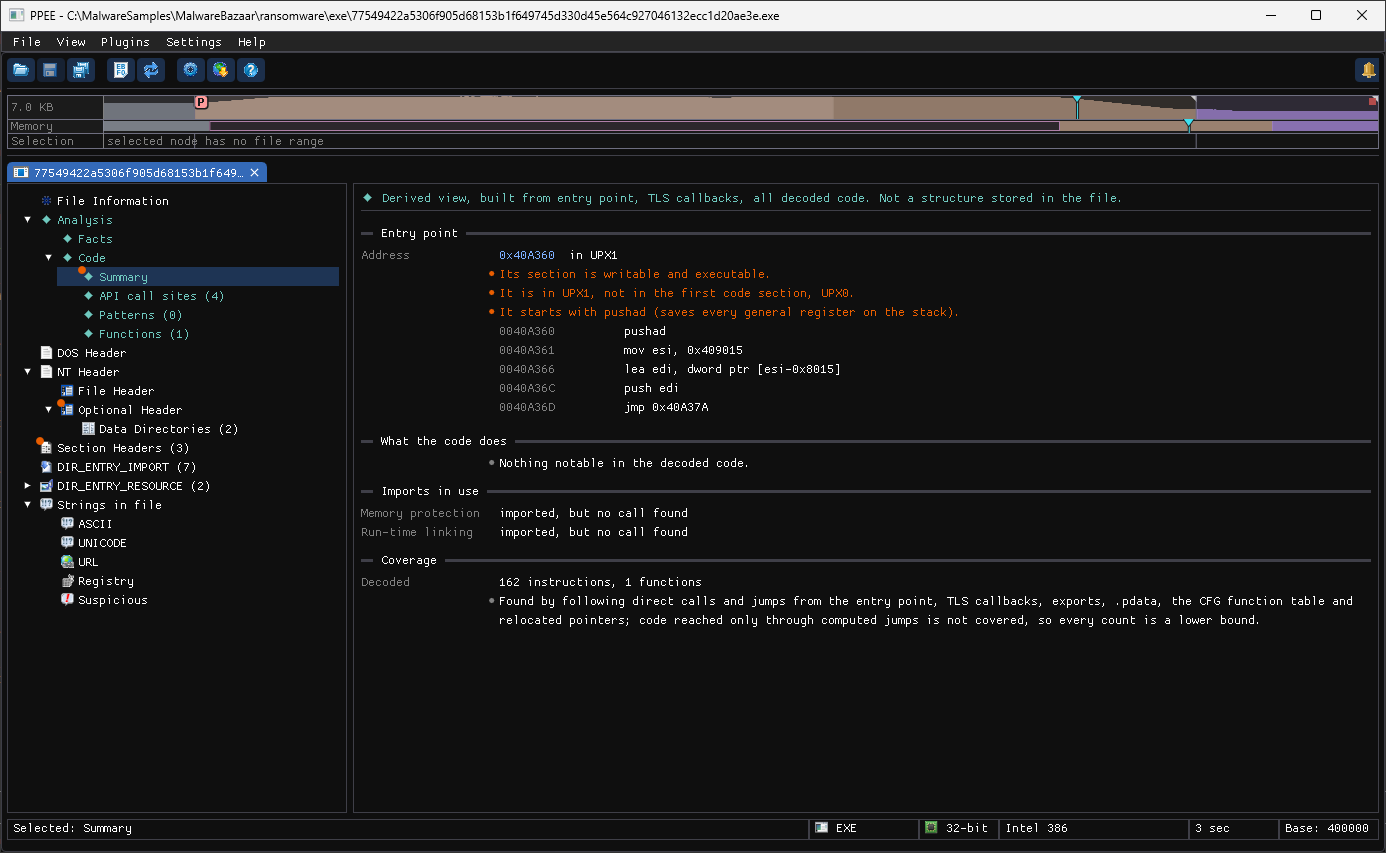
How to read it:
- Three warnings (
[*]) on the entry point say the same thing three ways: this is an unpacking stub, not compiled code. - Imported, but no call found for
VirtualAlloc/GetProcAddressis normal for a packer: the stub reaches them through registers it filled itself. - Only 162 instructions decode: the real program is still compressed inside
UPX1.
The summary tells you to look for the popad / jmp that ends the stub. Disassemble further from the entry point:
$ ppee-cli --disasm ep --count 300 77549422….exe | grep -A6 popad
  0040A4D5  61                    popad
  0040A4D6  8D 44 24 80           lea eax, dword ptr [esp-0x80]
  0040A4DA  6A 00                 push 0x0
  0040A4DC  39 C4                 cmp esp, eax
  0040A4DE  75 FA                 jnz 0x40A4DA
  0040A4E0  83 EC 80              sub esp, 0xFFFFFF80
  0040A4E3  E9 E9 7C FF FF        jmp 0x4021D1
The jmp 0x4021D1 lands in UPX0, the section with no file data (SizeOfRawData = 0): 0x4021D1 is the original entry point (OEP). That is where to set a breakpoint in a debugger, or what to pass to an unpacking tool.
Windows screenshot: The end of the UPX stub in the Code window: popad, the stack-clearing loop and jmp 0x4021D1 into UPX0
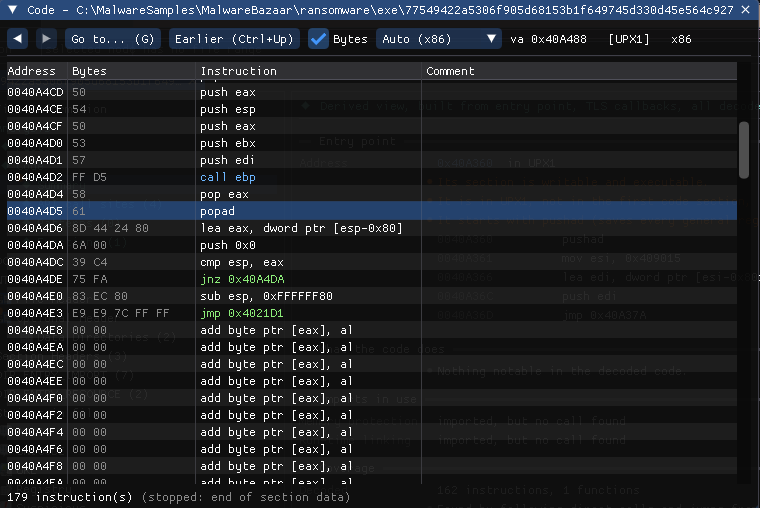
The same in the GUI: click the entry-point address in the Summary, press G, and go to 40A4D5. popad restores the registers, the push 0 / cmp esp, eax / jnz loop clears the stack, and the green jmp 0x4021D1 leaves the stub. After it there are only zero bytes, up to the end of the section's data.
Other packers trigger other rules
The same check flags Themida's .boot entry section, ASPack's pushad, Enigma's writable entry section, Delphi .itext stubs and random section names such as .x3vV (RemusStealer samples). Other warnings: entry point outside every section, a push / ret pair or a jump into another section as the first instructions.
An entry point that Control Flow Guard does not know
The loader calls the entry point (and every TLS callback) through a pointer, so a linker building with Control Flow Guard always lists it in the CFG function table. When a CFG-built file's entry point is not in that table, it was changed after linking:
Entry point
  Address: 0x180035040 [code 0x180035040: entry point]  in .text
  [*] The file is built with Control Flow Guard, but the entry point is not in its CFG function table, where the linker always puts it: the entry point was changed after linking (a packer, protector or file infector).
This is appxsip.dll with its AddressOfEntryPoint moved 16 bytes on. It is a strong sign because compilers never produce it. It also catches an entry point that was redirected inside .text, which the section rules above cannot see.
Walkthrough 2: a shellcode loader
At a glance
- Sample
86c6bd8098246eaf4527d9caa406221b3ff1ce551cf3b029cfc71d2e5e7a7963.exe(1 MB, PE32+, from a RemusStealer set)- Question
- Which APIs does the code use that the import table doesn't show?
- You'll use
- Code Summary, Imports in use ·
--strings - Full story
- From a URL to its call site (GUI) · the CLI version
$ ppee-cli --analysis 86c6bd80….exe
Imports in use
  Memory protection: VirtualFree (2), VirtualProtect (3)
  Run-time linking: GetProcAddress (5), GetModuleHandleA (4), GetModuleHandleW (2), GetModuleHandleExW (2), LoadLibraryExW (2)
  Network: WinHttpSendRequest (1), WinHttpReadData (2), WinHttpOpen (1), WinHttpConnect (1)
  Registry and services: RegSetValueExA (1)
  Debugger queries: IsDebuggerPresent (1)
  Starting programs: CreateProcessA (1), CreateProcessW (1)
  APIs resolved at run time: CorExitProcess, CreateThread, VirtualAlloc, VirtualProtect, kernel32.dll
  - Looked up with GetProcAddress rather than imported, so they are not in the import table.
PS C:\> ppee-cli.exe --analysis C:\MalwareSamples\86c6bd8098246eaf4527d9caa406221b3ff1ce551cf3b029cfc71d2e5e7a7963.exe
C:\MalwareSamples\86c6bd8098246eaf4527d9caa406221b3ff1ce551cf3b029cfc71d2e5e7a7963.exe: 1048576 bytes, PE32+

Analysis (derived views, not PE structures):

Code
  Detected: x64 machine code

Code > Summary  (built from entry point, TLS callbacks, all decoded code)
Entry point
  Address: 0x14000B3B0 [code 0x14000B3B0: entry point]  in .text
        14000B3B0  sub rsp, 0x28
        14000B3B4  call 0x14000BBD0
        14000B3B9  add rsp, 0x28
        14000B3BD  jmp 0x14000B230

What the code does
  - String built on the stack: "SystemRoot" -- sub_14002947C+0x3F [code 0x1400294BB: stack_string]
        1400294AE  test rcx, rcx
        1400294B1  jz 0x14002972E
        1400294B7  lea r8, qword ptr [rbp-0x20]
      > 1400294BB  mov dword ptr [rbp-0x20], 0x74737953
  - Queries CPU identification (cpuid) -- sub_14000B8BB+0x7 [code 0x14000B8C2: cpuid]
        14000B8B9  xor ecx, ecx
        14000B8BB  mov qword ptr [rsp+0x38], rbx
        14000B8C0  xor eax, eax
      > 14000B8C2  cpuid                                         ; queries CPU identification (cpuid)
  - Queries CPU identification (cpuid) -- sub_14000B8BB+0x2C [code 0x14000B8E7: cpuid]
        14000B8DB  or edx, ebx
        14000B8DD  mov eax, 0x1
        14000B8E2  mov ecx, 0x0
      > 14000B8E7  cpuid                                         ; queries CPU identification (cpuid)
  - Queries CPU identification (cpuid) -- sub_14000B8BB+0xB1 [code 0x14000B96C: cpuid]  (6 more: see Patterns)
        14000B963  jl 0x14000B9BD
        14000B965  xor ecx, ecx
        14000B967  mov eax, 0x7
      > 14000B96C  cpuid                                         ; queries CPU identification (cpuid)

Imports in use
  Memory protection: VirtualFree (2), VirtualProtect (3)
  Run-time linking: GetProcAddress (5), GetModuleHandleA (4), GetModuleHandleW (2), GetModuleHandleExW (2), LoadLibraryExW (2)
  Network: WinHttpSendRequest (1), WinHttpReadData (2), WinHttpOpen (1), WinHttpConnect (1)
  Registry and services: RegSetValueExA (1)
  Debugger queries: IsDebuggerPresent (1)
  Starting programs: CreateProcessA (1), CreateProcessW (1)
  Modules loaded by name: kernel32
  ...
Read it as a sentence: it gets VirtualAlloc and CreateThread with GetProcAddress, so they are not in its import table, and changes memory protection with VirtualProtect. Allocate, copy, make executable, run in a new thread: the standard in-memory shellcode loader.
Windows screenshot: Imports in use for the shellcode loader: capability groups, and VirtualAlloc and CreateThread resolved at run time
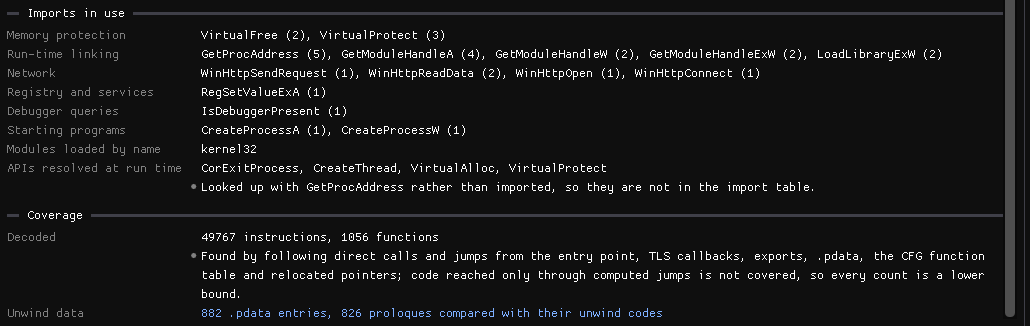
--strings gives the download URL, http://95.164.53.193:5001/uos.bin, and the disassembly walkthrough follows it from the URL to the CreateThread call, step by step.
Not every call is in this list
The download itself goes through urlmon.URLDownloadToCacheFileW, which is not one of the capability groups above. Check API call sites or --imports for the APIs a group doesn't cover.
Walkthrough 3: a browser-credential stealer
At a glance
- Sample
STEALERDLL.dll(1.2 MB, PE32+, not packed)- Question
- What does it steal, judged from the code rather than from import names?
- You'll use
- Code Summary ·
--xrefs
$ ppee-cli --analysis STEALERDLL.dll
Imports in use
  Other processes: OpenProcess (1)
  Run-time linking: LoadLibraryA (4), LoadLibraryW (1), GetProcAddress (25), …
  Network: HttpOpenRequestA (2), InternetReadFile (2), InternetConnectA (2), HttpSendRequestA (1), InternetOpenA (1), …
  Cryptography: BCryptOpenAlgorithmProvider (1), BCryptGenerateSymmetricKey (1), BCryptDecrypt (1)
  Stored credentials: CryptUnprotectData (3)
  Debugger queries: OutputDebugStringW (1), OutputDebugStringA (1), IsDebuggerPresent (2)
  Starting programs: CreateProcessA (1)
  Modules loaded by name: mscoree.dll, nss3.dll
  APIs resolved at run time: CorExitProcess, NSS_Init, NSS_Shutdown, PK11SDR_Decrypt, PK11_Authenticate, PK11_FreeSlot, PK11_GetInternalKeySlot, PL_Base64Decode
  - Looked up with GetProcAddress rather than imported, so they are not in the import table.

Coverage
  Decoded: 243512 instructions, 4102 functions
PS C:\> ppee-cli.exe --analysis C:\MalwareSamples\STEALERDLL.dll
C:\MalwareSamples\STEALERDLL.dll: 1282048 bytes, PE32+

Analysis (derived views, not PE structures):

Code
  Detected: x64 machine code

Code > Summary  (built from entry point, TLS callbacks, all decoded code)
Entry point
  Address: 0x1800CFD74 [code 0x1800CFD74: entry point]  in .text
        1800CFD74  mov qword ptr [rsp+0x8], rbx
        1800CFD79  mov qword ptr [rsp+0x10], rsi
        1800CFD7E  push rdi
        1800CFD7F  sub rsp, 0x20
        1800CFD83  mov rdi, r8
        1800CFD86  mov ebx, edx
        1800CFD88  mov rsi, rcx
        1800CFD8B  cmp edx, 0x1
        1800CFD8E  jnz 0x1800CFD95
        1800CFD90  call 0x1800D00F8
        1800CFD95  mov r8, rdi
        1800CFD98  mov edx, ebx

What the code does
  - Reads PEB.NtGlobalFlag -- sub_1800DF6E8+0x12 [code 0x1800DF6FA: peb_ntglobalflag]
        1800DF6F0  call 0x1800E5044
        1800DF6F5  cmp eax, 0x1
        1800DF6F8  jz 0x1800DF722
      > 1800DF6FA  mov rax, qword ptr gs:[0x60]                  ; reads the PEB (process environment block)
  - String built in memory: "sqlite3_" -- sub_18005C7F0+0x20A [code 0x18005C9FA: memory_string]
        18005C9E9  lea r10d, qword ptr [rbx-0x1]
        18005C9ED  sub rcx, r14
        18005C9F0  mov rax, 0x5F336574696C7173
      > 18005C9FA  mov qword ptr [r11], rax
  - String in instruction immediates: "localhos" -- sub_1800870C0+0x16B [code 0x18008722B: immediate_string]
        18008721C  cmp ecx, 0x10
        18008721F  jnz 0x18008723B
        180087221  mov rax, 0x736F686C61636F6C
      > 18008722B  cmp rax, qword ptr [r8]
  - Constant 0x67452301: MD5/SHA-1 initial state -- sub_180089D50+0x11 [code 0x180089D61: crypto_constant]
        180089D58  push r15
        180089D5A  sub rsp, 0x58
        180089D5E  mov rbp, rdx
      > 180089D61  mov dword ptr [rsp+0x40], 0x67452301
  - Constant 0x10325476: MD5/SHA-1 initial state -- sub_180089D50+0x32 [code 0x180089D82: crypto_constant]
  ...
This is the useful part of the report, and none of it is in the import table alone:
| Line | What it tells you |
|---|---|
Modules loaded by name: nss3.dll | The code loads Firefox's NSS library with LoadLibrary |
APIs resolved at run time: … PK11SDR_Decrypt … | It then looks up the NSS function that decrypts saved Firefox/Thunderbird passwords. PPEE found the names by reading the string passed to each GetProcAddress call |
Stored credentials: CryptUnprotectData (3) | Three calls to DPAPI: how Chromium-based browsers' saved passwords and cookies are decrypted |
BCryptDecrypt + BCryptGenerateSymmetricKey | AES decryption, used for newer Chrome v10/v20 encrypted values |
Network: HttpSendRequestA … | A way to send the result out |
Together: a browser password stealer, decided from code that calls those APIs, not from a guess on import names. Follow up with --xrefs CryptUnprotectData to see each call and its arguments.
What the code does lists patterns with evidence. For this sample:
  - Reads PEB.NtGlobalFlag -- sub_1800DF6E8+0x12 [code 0x1800DF6FA: peb_ntglobalflag]
        1800DF6F0  call 0x1800E5044
        1800DF6F5  cmp eax, 0x1
        1800DF6F8  jz 0x1800DF722
      > 1800DF6FA  mov rax, qword ptr gs:[0x60]                  ; reads the PEB (process environment block)
  - Constant 0x67452301: MD5/SHA-1 initial state -- sub_180089D50+0x11 [code 0x180089D61: crypto_constant]
The > marks the instruction the pattern was found at; the lines above it are lead-in. A bracketed [code 0x…: …] is a link to code: pass the address to --disasm va:0x… to read more. Click it in the GUI to open the Code window there.
Unwind data (x64)
On x64, Windows does not walk the stack by following rbp. When an exception is thrown, or a debugger, a profiler or an EDR walks a thread's stack, the unwinder looks the function up in the exception directory (.pdata) and reads its unwind codes: what the function's prologue did (pushed rbx, allocated 0x28 bytes, set rbp as frame pointer). It undoes exactly that to find the caller.
A compiler writes the prologue and its unwind codes together, so they match. They stop matching when someone changes the code after it was built, or writes it by hand. PPEE decodes each prologue and compares it with its codes. The results go where you read the data they are about:
| Where | What |
|---|---|
| Exception directory, Check column | Every .pdata entry's own result: out of order, bad UNWIND_INFO, a prologue that does not match its codes, … |
| What the code does and Patterns | prolog_hooked: a function whose prologue was overwritten. no_unwind: a function that uses the stack but has no .pdata entry |
| Summary → Coverage | How many entries and prologues were compared, how many disagree, or one sentence when the whole table is packed, the code is encrypted, or there is no .pdata at all. Each links to the Exception directory |
Walkthrough 4: a hooked function in a protected crackme
At a glance
- Sample
crackme-Section_name.exe(SHA-2563cdfc441…ecc27, PE32+)- Question
- Was any function changed after the file was built?
- You'll use
- Code Summary, Coverage · Exception directory ·
--disasm
$ ppee-cli --analysis crackme-Section_name.exe
What the code does
  - The function starts with "jmp 0x140017A41": its prologue was replaced (a hook or a patch), the unwind data still describes the original -- sub_1400016D0 [code 0x1400016D0: prolog_hooked]
      > 1400016D0  jmp 0x140017A41
…
Coverage
  Unwind data: 60 .pdata entries, 57 prologues compared with their unwind codes [Exception directory]
  [*] 1 prologue(s) do not match their unwind codes. [Exception directory]
How to read it:
- The unwind data for
sub_1400016D0says the function starts withpush rbp,mov rbp, rsp,sub rsp, 0x10. The code there isjmp 0x140017A41followed byint3filler. The original prologue was overwritten after linking. -
Follow the jump:
$ ppee-cli --disasm va:0x140017A41 --count 2 crackme-Section_name.exe
Disassembly: va 0x140017A41, x64, section .binshld
   0000000140017A41  68 8F 67 01 00        push 0x1678F
   0000000140017A46  E9 B5 E5 FF FF        jmp 0x140016000
It lands in
.binshld, a section the compiler did not make.push <id>/jmp <dispatcher>is the usual shape of a code virtualizer: the original function was moved into the protector's VM, and the stub passes it an id.
The same check finds inline hooks
A hook installed by patching the file (malware that infects a DLL, a crack, a loader that replaces DllMain) leaves the old unwind data behind, so its first bytes no longer match. Hooks set in memory at run time leave the file unchanged and do not show here.
Walkthrough 5: no unwind data at all
At a glance
- Sample
M-Dl-exeption-tls.exe(SHA-256bed241e4…34544)- Question
- A 64-bit file with no
.pdata: what does that mean? - You'll use
- Code Summary, Coverage
$ ppee-cli --analysis M-Dl-exeption-tls.exe
Coverage
  [*] The file has no .pdata, yet 2 function(s) use the stack: an exception raised in any of them cannot be unwound.
Every x64 compiler emits .pdata. A 64-bit file without it was built by hand or by an unusual toolchain, or had the table removed. An exception thrown inside these functions cannot be unwound, so the process dies instead of reaching a handler. Shellcode loaders and packer stubs often look like this.
In a file that has .pdata, each function the code scan found outside every entry gets a no_unwind pattern instead. Leaf functions (no push, no sub rsp, no call) need no unwind data and are never reported. Neither are thunks that pop everything they pushed before their jmp/ret, such as the compiler's CFG dispatch thunks and MinGW's ___chkstk_ms.
Patterns inside exception handling
Anti-debugging tricks are usually built on exceptions. The code raises one on purpose (int3, int 2Dh, a bad memory access, a single-step). Without a debugger, the program's own handler runs. With one, the debugger takes the exception and the handler never runs, so the program can tell the difference. The PEB reads, timing checks and decoding loops around such a trick are therefore often in a __try block, an exception filter or a hand-registered handler.
PPEE reads the file's exception-handling data and adds that context to each pattern in What the code does, and as the Exception handling column of the Patterns view:
| Context | Where it comes from |
|---|---|
inside a __try block, exception filter <function> | x64: the __C_specific_handler scope table of the function. The filter decides whether the __except block runs |
inside a __try block, __except at <address> | The same, with the filter EXCEPTION_EXECUTE_HANDLER (always handle) |
inside a __try block with a __finally handler | A __try / __finally scope |
in an __except block, entered at <address> | After the __except entry, in the same function. The block's end is not recorded in the file, so this is the code just after it |
in an exception filter (runs when an exception is raised) of <function> | The pattern is in the filter itself, the code that runs at the moment of the exception |
in a __finally handler of <function> | The pattern is in a termination handler |
in a function with its own exception handler / in a hand-made exception handler, registered for <function> | x64: a handler that is not the compiler's (__C_specific_handler, __CxxFrameHandler, _GSHandlerCheck) and serves only this function |
in a SafeSEH-registered exception handler | x86: the function is in Load Config's SafeSEH table |
in a function that registers an SEH exception handler <handler> | x86: the function links an SEH frame (mov fs:[0], esp), itself or through an _SEH_prolog helper |
C++ try/catch and destructor cleanup (__CxxFrameHandler, and MSVC's x86 mov eax, offset FuncInfo; jmp __CxxFrameHandler stubs) are left out: every C++ function with a local object has them, so they say nothing about a pattern.
Two real examples:
$ ppee-cli --analysis c2-2tls-callback-records.dll          (x86, two TLS callbacks)
What the code does
  - Queries CPU identification (cpuid) -- sub_1043CDB3+0x91 [code 0x1043CE44: cpuid]; in a function that registers an SEH exception handler sub_107F9611+0xBAD7 [code 0x108050E8: …]

$ ppee-cli --analysis wintrust.dll                          (Windows 11 SDK, x64)
What the code does
  - Reads PEB.ProcessHeap -- sub_180018050+0x3D8 [code 0x180018428: peb_process_heap]; in an __except block, entered at sub_180018050+0x382 [code 0x1800183D2: …]
- In the first file,
cpuid(a common virtual-machine check) runs in a function that sets up its own SEH handler. Open the handler (the second link) to see what the code does when the check raises an exception. - In
wintrust.dllthe PEB read is ordinary recovery code in an__exceptblock. The context says where a pattern is, not whether it is malicious.
The context is rare. It only shows where the file's exception data really says so, and a packed or encrypted .pdata is ignored.
Patterns and hints
| Id | Says | Typical meaning |
|---|---|---|
peb_access | Reads the PEB | Generic; also in ordinary CRT and heap code |
peb_being_debugged, peb_ntglobalflag | Reads PEB.BeingDebugged / PEB.NtGlobalFlag | Debugger checks (the CRT also reads NtGlobalFlag) |
peb_ldr | Walks PEB.Ldr | Finding loaded modules without imports: shellcode and loaders |
peb_process_heap | Reads PEB.ProcessHeap | Heap access without GetProcessHeap |
xor_loop, transform_loop | Loop that xors (or rotates/negates) a buffer in place with a byte key | String or payload decoding |
stack_string | String built on the stack | Hiding strings from a strings scan |
memory_string | String written into a buffer in pieces (put back in order) | The same, or an inlined memcpy of a constant |
immediate_string | Text in the immediates of a cmp or push | An inlined compare against a name (xmrig.exe) |
The three string patterns are all listed (other patterns are sampled); MCP get_strings returns them as its code group. | crypto_constant | Known crypto/hash constant (MD5/SHA-1 state, CRC, AES …) | Hashing or encryption code |
Single instructions also get a hint, shown in the Comment column of the Code window and after ; in --disasm output:
| Hint | Says | Typical meaning |
|---|---|---|
peb_access | reads the PEB | see above |
rdtsc, cpuid | reads the time-stamp counter / queries CPU identification | Timing or VM checks, but common in ordinary code |
debug_trap | raises a debug trap (int 2Dh / int1) | Anti-debugging trick |
direct_syscall | makes a system call directly, not through ntdll | Bypassing user-mode API hooks (EDR evasion) |
get_pc | reads its own address (call $+5 / fnstenv) | Position-independent shellcode |
ror13 | rotates a register by 13 | The classic API-name hash of Metasploit/Cobalt Strike shellcode |
Windows screenshot: What the code does: a stack string 'SystemRoot' and cpuid hints, each with its evidence instructions
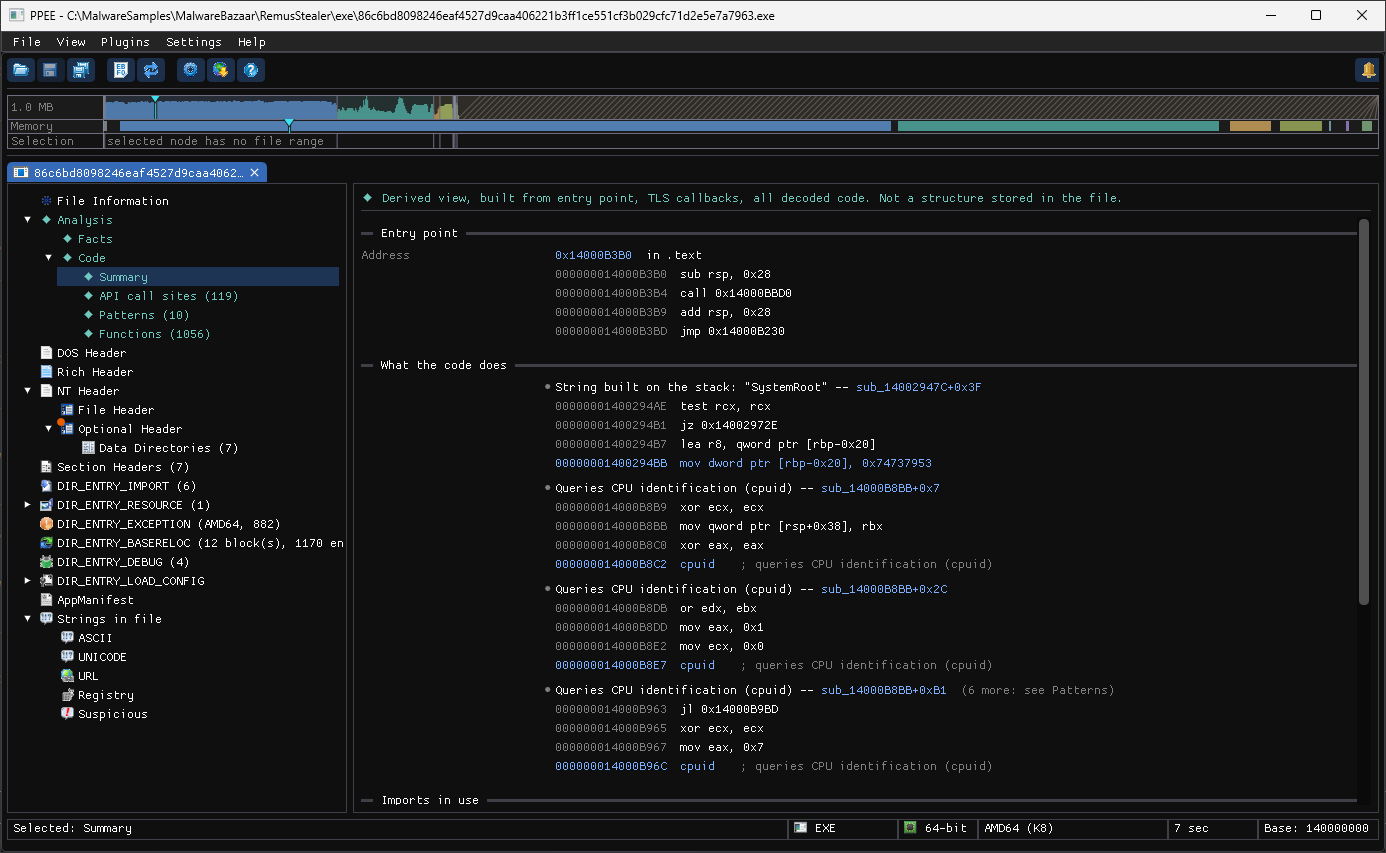
In the GUI, What the code does puts each pattern above its evidence. For the shellcode loader, SystemRoot is built on the stack (mov dword ptr [rbp-0x20], 0x74737953 is "Syst"), so a strings scan never sees it. The cpuid hints are in the comment column. Every blue address opens the Code window.
Neutral wording on purpose
Patterns say what the code does ("loop that xors a buffer in place with 0x5A"), not what it means. Every pattern above also turns up in legitimate software, including Windows system files. Only entry-point anomalies and one combination rule (a single function that allocates memory in another process, writes there and starts or redirects a thread there: process injection) are shown as warnings, because they are rare in legitimate files.
Coverage and limits
- Code is found by following direct calls and jumps from the entry point, TLS callbacks, exports, x64
.pdata, the CFG function table, relocated code pointers and, for Delphi, the VMTs and published-method tables. Code reached only through computed jumps is not covered, so every count is a lower bound. - Packed code is not visible until it is unpacked (walkthrough 1).
- The scan stops at a budget (5 million instructions by default, see Settings). Bigger files are covered in part and the counts say so.
- Without a scan (the GUI's background scan turned off, or
ppee-cli --no-code-scan) the Summary still checks the entry point and TLS callbacks, in milliseconds instead of seconds on a large file.--scan-budget Nsets the budget in millions of instructions (1–50).
Where to get it
Analysis → Code. The entry point and TLS checks are there as soon as the file loads; call sites, patterns and functions fill in when the background code scan finishes. Rows and evidence lines open the Code window (corner mark, double-click, or right-click → Show Code / Ctrl+D).
triage_pe carries the entry-point and unwind findings with their evidence and the Code runtime's facts. analyze_pe with sections: ["exception"] gives each .pdata entry's check. analyze_pe with sections: ["analysis"] gives the full views.
View keys: analysis.code.summary, analysis.code.calls, analysis.code.patterns, analysis.code.functions. Code links in JSON carry a va instead of a file offset, and evidence is a code block with lines[] (va, text).
Related: Disassembly & Cross-references (CLI) · Code window (GUI) · Import directory
References
- Intel 64 and IA-32 Architectures Software Developer's Manuals: the instruction set reference behind the disassembly.
- x64 calling convention (Microsoft): how arguments are passed in registers on x64 Windows, useful when reading call sites.