Debug Directory
Data directory 6
IMAGE_DIRECTORY_ENTRY_DEBUG: DataDirectory[6] in the Optional header. All data directories
The debug directory is an array of IMAGE_DEBUG_DIRECTORY entries left by the compiler and linker. The most valuable one, CodeView (RSDS), records the path of the PDB file on the build machine, together with a GUID and age that identify the exact build. For threat intelligence it's one of the best attribution and clustering artifacts in a PE file, because authors often forget it's there.
How the structure works
| Entry field | Meaning |
|---|---|
Type | What the entry describes (table below) |
TimeDateStamp | Usually the link time. For repro builds it's a hash, not a date |
SizeOfData | Size of the entry's data |
AddressOfRawData / PointerToRawData | RVA and file offset of the data |
A CodeView RSDS record contains "RSDS", a 16-byte GUID, a 32-bit age and the PDB path. Symbol servers index PDBs by GUID + age, so these three values uniquely identify the build.
| Type | Name in PPEE | Why you care |
|---|---|---|
| 1 | COFF | Legacy COFF symbols |
| 2 | CODEVIEW | PDB path, GUID, age |
| 3 | FPO | Frame-pointer omission records (x86) |
| 4 | MISC | Legacy (often a DBG file name) |
| 9 | BORLAND | Borland/Embarcadero toolchain |
| 12 | VC_FEAT | Counts of /GS, /sdl and similar compiler features |
| 13 | POGO | Profile-guided optimization section records |
| 14 | ILTCG | Built with link-time code generation |
| 16 | REPRO | Deterministic build: the timestamps are hashes |
| 17 | EMDEDDED_PORTABLE_PDB | A .NET portable PDB embedded in the file |
| 19 | PDB_CHECKSUM | Hash of the matching PDB |
| 20 | EX_DLLCHARACTERISTICS | Extended flags such as CET shadow-stack compatibility |
| 21 | PERFMAP | .NET perf map |
What PPEE shows
- Upper list: one row per entry: Characteristics · TimeDateStamp · Meaning (the decoded date) · Major/MinorVersion · Type · SizeOfData · AddressOfRawData · PointerToRawData.
- Child nodes decode each entry: CodeView (signature, GUID, age, PDB path), FPO (n) records, POGO (n) section records, and the others by type name.
- Follow in Hex View (Ctrl+H) jumps to the raw entry data.
Windows screenshot: Debug directory of a shellcode loader: four entries and the decoded CodeView record with a PDB path under C:\Users\Administrator
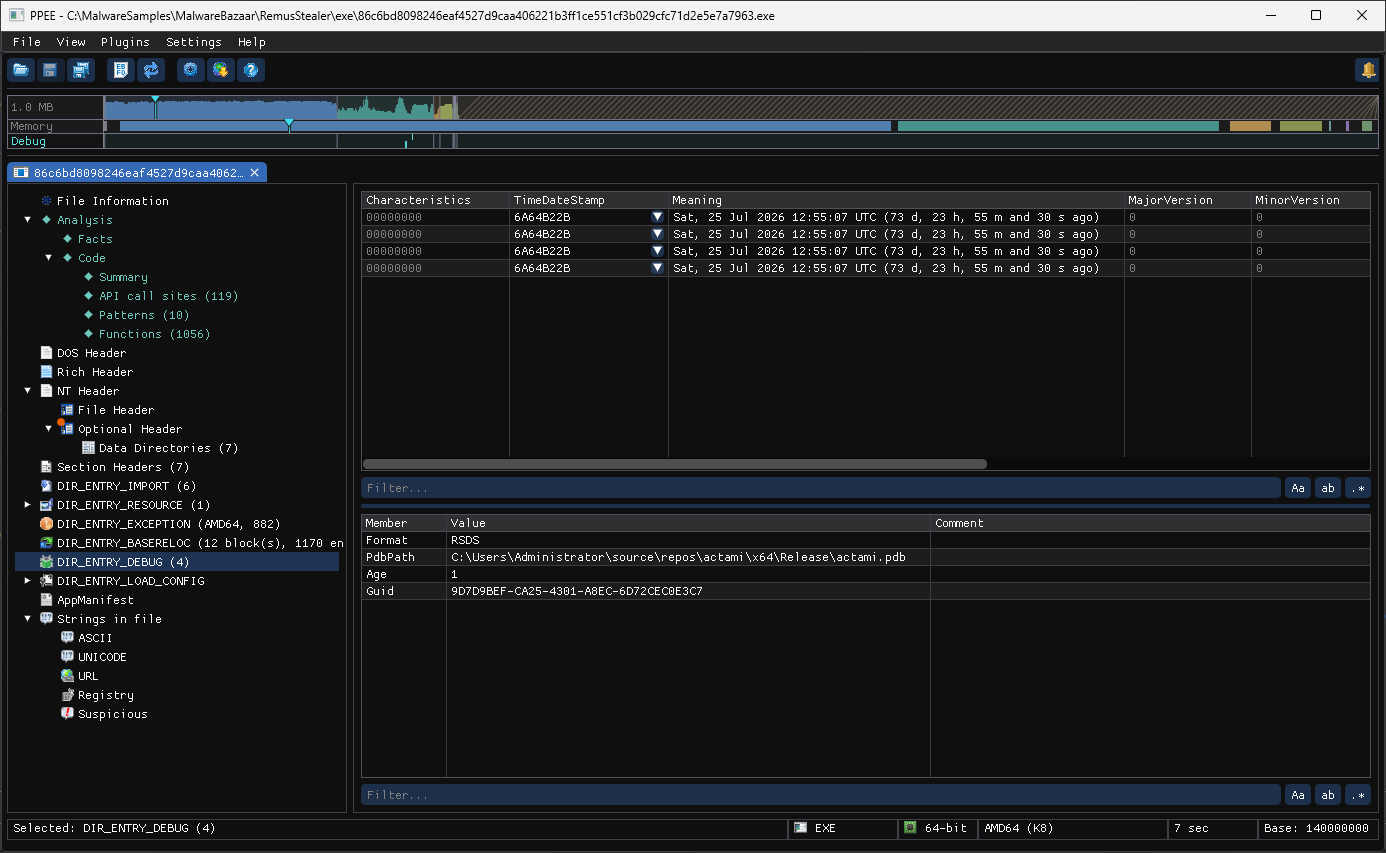
A shellcode loader (86c6bd80….exe): four entries above, and the CodeView record below with RSDS, the GUID, age 1 and the PDB path C:\Users\Administrator\source\repos\actami\x64\Release\actami.pdb. That is Visual Studio's default project folder, so the project name actami is the lead to search for. The Meaning column dates every entry (25 Jul 2026).
Reproducible builds are called out
When a REPRO entry is present, PPEE's runtime analysis says so in its Summary and links to the entry (and to the hash bytes when the entry carries them). In the GUI, the entry's Size row can be followed in the hex view.
Reading debug data like an analyst
| Observation | What it suggests |
|---|---|
PDB path with a user name or project name (C:\Users\<name>\source\repos\stealer\Release\x.pdb) | Attribution and clustering: search the path, or just the file name, across your sample set and in public sandboxes |
PDB path from a build server (C:\TfsBuildTemp\…, D:\a\_work\1\s\…) | Legitimate CI-built software, or a stolen/rebuilt copy of it |
| Same GUID + age in two files | The same build, even if other bytes differ |
| No debug directory at all | Stripped by the toolchain (Go, some Rust builds, many packers) or deliberately removed. Common in malware |
| Garbage entry types or sizes | The directory size covers more than the real entries: parser confusion, or a tampered header |
| CodeView present but PDB path is empty or random | Deliberately scrubbed or forged |
REPRO entry | Timestamps are hashes: don't use them to date the build |
Real samples
STEALERDLL.dllnames itself:D:\Mktmp\StealerDLL\Release.x64\STEALERDLL.pdb, age 212 (the author rebuilt it about 200 times).- RustyStealer builds keep short PDB names that still say what they are:
injector.pdb,svc_agent.pdb,kuinabot.pdb,netcfg.pdb. Several unrelated-looking samples sharenewwapcu.pdb: one project, many builds. - Three malware samples (a Go C2 implant, a sideloading DLL and a stealer) have no debug directory.
- A commercial binary leaks its internal build layout:
C:\Package_QB_Agent\workspace\root\PACKAGES_IOS\DeXonPC_Windows\Schedule\Prod_OneUI40\src\Bin\Market\Win32\PDBFiles\SCommon.pdb. - A .NET library has a CodeView entry plus type 16 (REPRO) with
TimeDateStamp 0: a deterministic build. - A component library's debug directory claims 4 entries, but only the first is real. The other three are the bytes of the PDB path read as entries;
pointerToRawData=545C3A43is ASCIIC:\T:
CLI and JSON
$ ppee-cli --debug STEALERDLL.dll
Debug directory: 4 entrie(s)
  type=2 sizeOfData=71 pointerToRawData=119EDC [RSDS pdb=D:\Mktmp\StealerDLL\Release.x64\STEALERDLL.pdb age=212 guid=99F662A8-FCA0-49B6-B44E-FB7204BF0677]
  type=12 sizeOfData=20 pointerToRawData=119F24
  type=13 sizeOfData=852 pointerToRawData=119F38
  type=14 sizeOfData=0 pointerToRawData=0
PS C:\> ppee-cli.exe --debug C:\MalwareSamples\STEALERDLL.dll
C:\MalwareSamples\STEALERDLL.dll: 1282048 bytes, PE32+

Debug directory: 4 entrie(s)
  type=2 sizeOfData=71 pointerToRawData=119EDC [RSDS pdb=D:\Mktmp\StealerDLL\Release.x64\STEALERDLL.pdb age=212 guid=99F662A8-FCA0-49B6-B44E-FB7204BF0677]
  type=12 sizeOfData=20 pointerToRawData=119F24
  type=13 sizeOfData=852 pointerToRawData=119F38
  type=14 sizeOfData=0 pointerToRawData=0
Type 2 is CodeView (the PDB path, GUID and age), 12 VC feature, 13 POGO, 14 ILTCG. Compare explorer.exe: pdb=explorer.pdb age=1 plus a type-16 REPRO entry.
JSON: debug[] → type, timeDateStamp, sizeOfData, pointerToRawData, and for CodeView codeView (format, pdbPath, age, guid).
Hunting recipes
# PDB path, GUID and age
ppee-cli --json --debug f.exe | jq -r '.debug[].codeView | select(.) | "\(.pdbPath)\t\(.guid)\t\(.age)"'

# Build a PDB-path index for a sample set, then cluster by PDB file name
for f in samples/*; do
  ppee-cli --no-similarity --json --debug "$f" 2>/dev/null \
    | jq -r --arg f "$f" '.debug[]?.codeView | select(.) | "\(.pdbPath | split("\\") | last)\t\(.pdbPath)\t\($f)"'
done | sort > pdb-index.tsv
cut -f1 pdb-index.tsv | uniq -c | sort -rn | head

# PDB paths that contain a Windows user profile (possible attribution)
jq -r '.debug[]?.codeView.pdbPath // empty' < report.json | grep -i '\\Users\\'

# Files without any debug directory
for f in samples/*; do [ "$(ppee-cli --no-similarity --json --debug "$f" 2>/dev/null | jq '.debug | length')" = 0 ] && echo "$f"; done
Related: --debug · Rich header (toolchain fingerprint) · Similarity engine
References
- Microsoft PE format specification, debug data: the debug directory and its entry types.
- /DEBUG, generate debug info (Microsoft): how the linker creates the PDB that the CodeView entry names.